3 Participation in GVCs
The objective of this section of RIVA is to describe the structure of an economy’s GVC related exports. This helps highlight the nature of an economy’s GVC related exports and the extent to which its exports rely on forward and backward GVC linkages. The broader insights gained in this section can form the basis to guide users in undertaking more detailed GVC analyses in ‘Backward linkages’ and ‘Forward linkages’ discussed in subsequent sections of this guide.
In this example, let us consider Thailand’s GVC participation in its exports to the world. Have a closer look at the GVC participation section on the website to find out more GVC participation for Thailand, or any other economy you may be interested in.
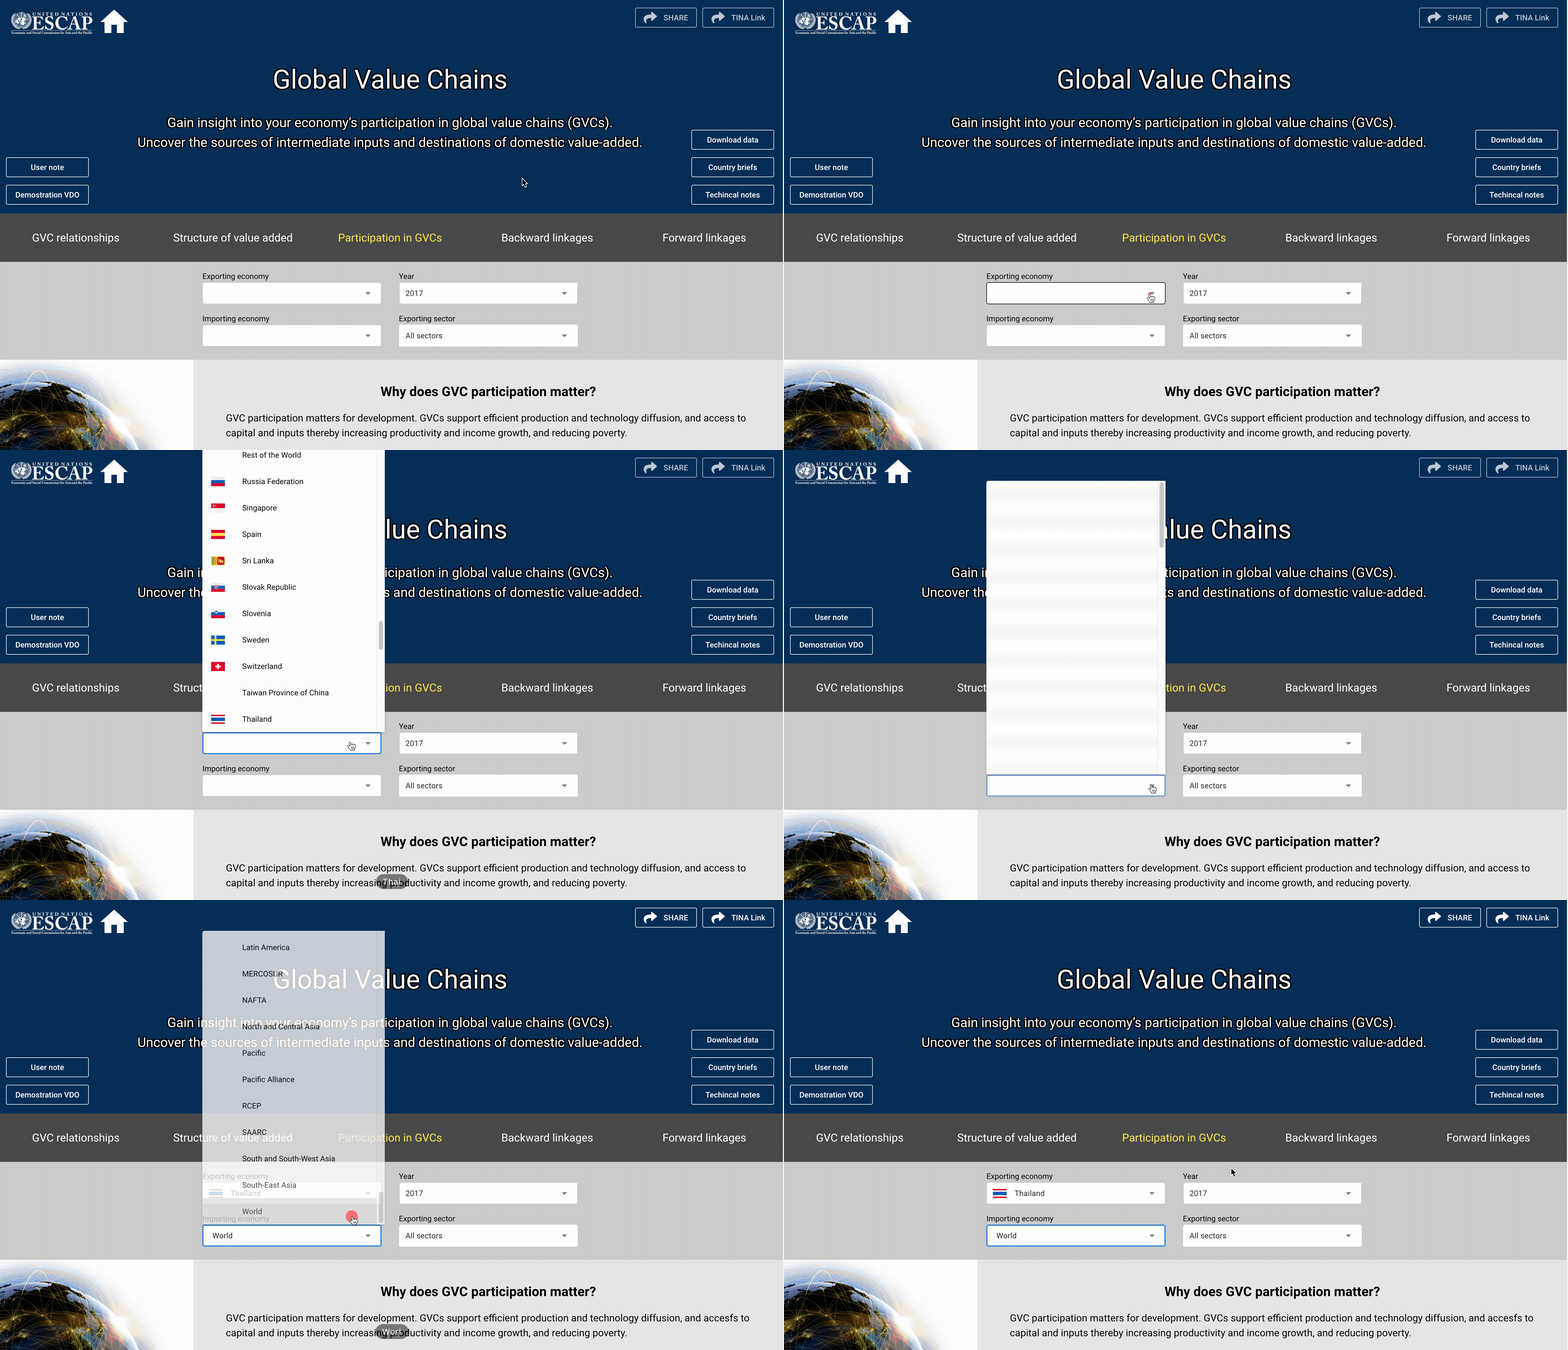
To look at Thailand’s GVC related export structure to the world, click on the ‘Participation in GVCs’ section on the navigation bar. From here, choose your exporting economy of interest (in this example, Thailand) and importing economy (in this example, ‘World’) from the drop-down menu as shown below:

Figure 3.1: Participation in GVCs: Choosing exporting and importing economies
You can change the year of interest or exporting sector in a similar manner. In this example, we maintain the pre-selected year, i.e. 2017, and the pre-selected exporting sector, i.e. ‘All sectors’.
The visualization you will see after making these selection is shown below:
This visualization provides a number of insights. Firstly, it shows us what share of Thailand’s gross exports to the world are GVC related — as a % of Thailand’s gross exports to the world — measured as the sum of 4 value-added components of exports which relate to participation in GVCs. This can be inferred by simply viewing the figure. This can directly be compared to equivalent values for other economies in the same region (in this case, South-East Asia). As we can see, this amounts to over 40% of Thailand’s gross exports to the world — with almost half of this comprising ‘Domestic production used in the importers exports’ (i.e. forward linkages), highlighting Thailand’s dependence on export production in other economies. This is something that can explored in more depth in the ‘Forward linkages’ section of the website to understand which economies Thailand exports these intermediate inputs to and which exporting sectors in Thailand are most engaged in these forward linkages.
There are also a number of additional insights that this graph offers us through its interactive features. Simply hover your mouse over any of the bars in the graph to see relevant information:
For example, hover your mouse over the red bar (Domestic production used in the importer’s exports) for Thailand. You will see that this particular GVC related value-added component of Thailand’s exports accounts for 16.38% of Thailand’s gross exports to the world. This amounts to $39.13 billion. Furthermore, the total value of Thailand’s GVC related exports is also shown ($106.64 billion).
In a similar manner, you can examine any bar in the graph for any of the economies shown to get detailed insight on a particular GVC component of exports.
You can also click on any of the legend items to remove a selected component from the graph. Click it again to add it back in.
Finally, you can also download the graph and underlying data by simply clicking on the three horizontal bars icon on the top right corner of the graph and choose your preferred format for download.