1 GVC relationships
The objective of this first section of RIVA is to provide an overview of an economy’s total backward and forward GVC linkages. This helps highlight, in its broadest form, the relevance of GVCs for an economy’s overall exports.
As an example, let us look at Thailand to see how much of the country’s exports involve backward and forward GVC linkages. Have a closer look at the GVC relationships section on the website to find out more about the key partners and sectors that are involved in these GVC linkages for Thailand, or any other economy you may be interested in.
To undertake this analysis of Thailand’s GVC relationships, click ‘Get Started’ on the home page of RIVA Value Chain Analyzer. You will be directed to the ‘GVC relationships’ section of the platform. From here, choose your exporting economy of interest (in this example, Thailand) from the drop-down menu as shown below:
Figure 1.1: *GVC relationships: Choosing an exporting economy
You can change the year of interest in a similar manner. In this example, we maintain the pre-selected year, i.e. 2017, the most recent year with available data.
The first visualization that appears in this section — once you have made your selection from the drop-down menus — is shown below:
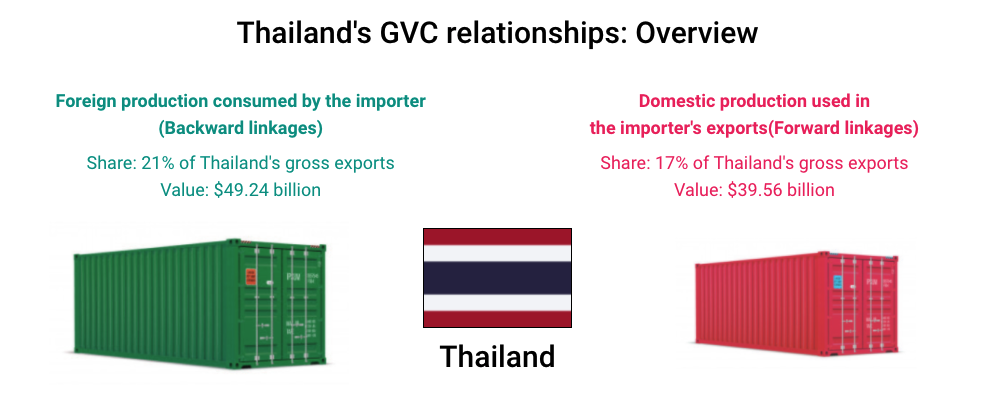
This visualization shows us what share of Thailand’s gross exports to the world involve backward and forward GVC linkages, as a % of Thailand’s gross exports to the world as well as in absolute US$ terms. The following insights can be gained from this visualization:
Backward linkages of Thailand account for 21% of its gross exports ($49.24 billion). In other words, 21% of Thailand’s gross exports to the world is foreign production (or imported content) that it uses to produce its own exports. This figure highlights the extent to which Thailand depends on imports to produce its own exports.
Forward linkages of Thailand account for 17% if its gross exports ($39.56 billion). In other words, 17% of Thailand’s gross exports to the world is domestic value-added that is then used by importing economies to produce their own exports. This figure highlights the extent to which Thailand depends on export production in other economies.
The second visualization that appears in this section is shown below:
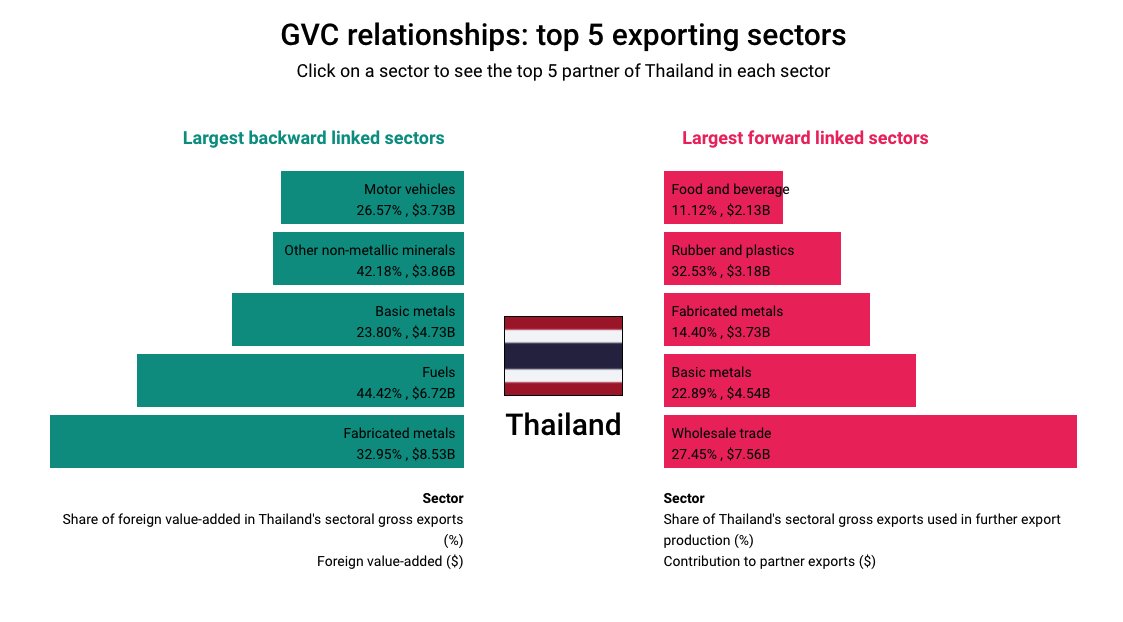
This visualization describes the top 5 exporting sectors in Thailand with the largest forward and backward linkages in absolute US$ terms. The size of the bar corresponds to the US$ value of backward or forward linkages.
These graphs can be interpreted as follows:
Consider backward linkages for Thailand’s ‘Fabricated metals’ sector, i.e. the largest green bar on the left. The value 32.95% refers to the share of backward linkages in the sector’s gross exports to the world. This means that 32.95% of Thailand’s ‘Fabricated metals’ sector exports to the world is foreign production (or imported content) that it uses to produce its own exports. This value highlights the extent to which ‘Fabricated metals’ sector in Thailand depends on imports to produce its own exports. In US$ terms this 32.95% is equivalent to $8.53 billion.
Consider forward linkages for Thailand’s ‘Wholesale trade’ sector, i.e. the largest red bar on the right. The value 27.45% refers to the share of forward linkages in the sector’s gross exports to the world. This means that 27.45% of Thailand’s ‘Wholesale trade’ sector exports to the world is domestic value-added that is then used by importing economies to produce their own exports. This value highlights the extent to which ‘Wholesale trade’ sector in Thailand depends on export production in other economies. In US$ terms this 27.45% is equivalent to $7.56 billion.
You can even see the top 5 partner economies of Thailand in each of these exporting sectors by simply clicking on a bar, as shown below:
Figure 1.2: Drilling down to see partners of Thailand in ‘Fabricated metals’ sector, backward linkages
In this example, we examine the major partner economies that are associated with Thailand’s ‘Fabricated metals’ sector backward linkages. The resulting drill-down bar chart shows (figure 1.2) us that Japan, China, United States, Republic of Korea and Russian Federation are the top partners. The values in this graph reflect the foreign production (or imported content) that Thailand’s ‘Fabricated metals’ sector sources from each of these economies, and uses for its own export production. As a specific example, consider the value for Japan, i.e. $1576M, which shows that Thailand’s ‘Fabricated metals’ sector uses $1,576 million worth of foreign production (or imported content) from Japan for its own export production.
You can examine forward linkages for Thailand’s exporting sectors in a similar way, to see the top 5 partner economies as below:
Figure 1.3: Drilling down to see partners of Thailand in ‘Wholesale trade’ sector, forward linkages
As an example, we examine the major partner economies that are associated with Thailand’s ‘Wholesale trade’ sector forward linkages. The resulting drill-down bar chart (figure 1.3) shows us that Ireland, Netherlands, Australia, Italy and Japan are the top partners. The values in this graph reflect Thailand’s ‘Wholesale trade’ sector’s contribution to further export production in other economies. As a specific example, consider the value for Ireland, i.e. $843M, which shows that Thailand’s ‘Wholesale trade’ sector contributes $843 million worth of domestic value-added in exports to Ireland that are then used by Ireland for its own export production.
The third visualization that appears in this section is shown below:
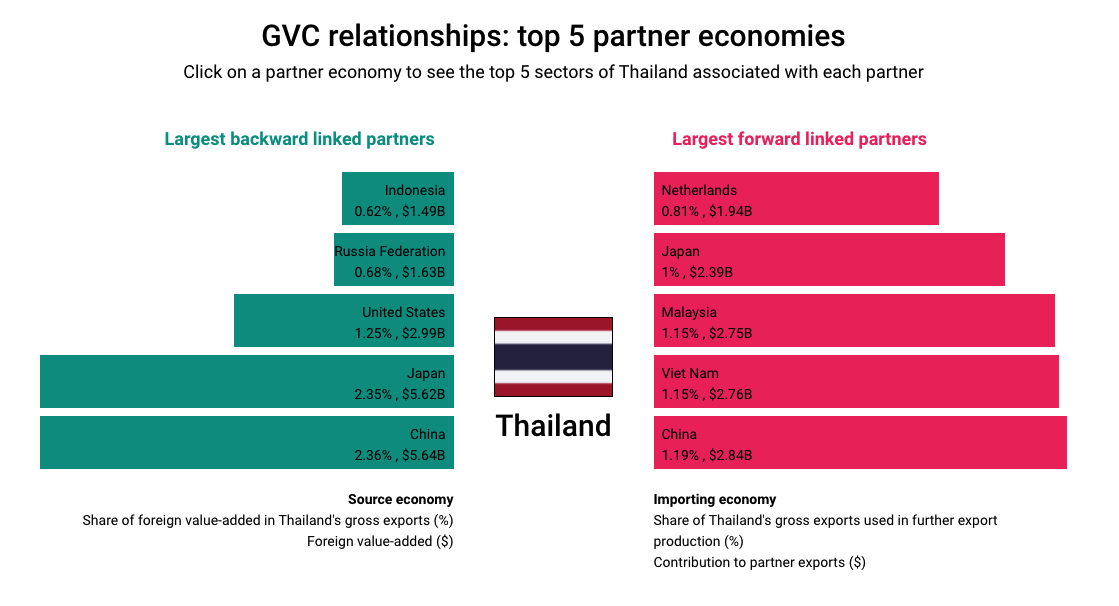
This visualization describes the top 5 partner economies with which Thailand has the largest forward and backward linkages in absolute US$ terms. The size of the bar corresponds to the US$ value of backward or forward linkages.
These graphs can be interpreted as follows:
Consider Thailand’s backward linkages with China, i.e. the largest green bar on the left. The value 2.36% refers to the share of backward linkages with China in Thailand’s gross exports to the world. This means that 2.36% of Thailand’s gross exports to the world is foreign production (or imported content) that comes from China and is used by Thailand to produce its own exports. This value highlights the extent to which Thailand depends on imports from China to produce its own exports. In US$ terms this 2.36% is equivalent to $5.64 billion.
Consider Thailand’s forward linkages with Viet Nam, i.e. the second largest red bar on the right. The value 1.15% refers to the share of forward linkages with Viet Nam in Thailand’s gross exports to the world. This means that 1.15% of Thailand’s gross exports to the world is domestic value-added that is used by Viet Nam for its own export production. This value highlights the extent to which Thailand depends on export production in Viet Nam. In US$ terms this 1.15% is equivalent to $2.76 billion.
You can even see the top 5 exporting sectors of Thailand associated with each of these partners by simply clicking on a bar, as shown below:
Figure 1.4: Drilling down to see Thailand’s exporting sectors with backward linkages to China
In this example, we examine the major exporting sectors in Thailand that are associated with Thailand’s backward linkages to China. The resulting drill-down bar chart (figure 1.4) shows us that these sectors in Thailand include ‘Fabricated metals’, ‘Basic metals’, ‘Motor vehicles’, ‘Food and beverage’ and ‘Fuels’. The values in this graph reflect the foreign production (or imported content) that each of these sectors of Thailand source from China, and use for their own export production. As a specific example, consider the value for ‘Fabricated metals’, i.e. $1246M, which shows that Thailand’s ‘Fabricated metals’ sector uses $1,246 million worth of foreign production (or imported content) from China for its own export production.
You can examine forward linkages for Thailand with a specific partner in a similar way, to see the top 5 exporting sectors in Thailand as below:
Figure 1.5: Drilling down to see Thailand’s exporting sectors with forward linkages to Viet Nam
Let us consider Thailand’s forward linkages with Viet Nam to see Thailand’s top exporting sectors associated with it. The resulting drill-down bar chart (figure 1.5) shows us that ‘Food and beverage’, ‘Chemicals’, ‘Basic metals’, ‘Fuels’, and ‘Textiles’ are the top exporting sectors in Thailand associated with forward linkages to Viet Nam. The values in this graph reflect the domestic value-added by each of these sectors in Thailand that are used by Viet Nam for its own export production. As a specific example, consider the value for ‘Food and beverage’, i.e. $653M, which shows that Thailand’s ‘Food and beverage’ sector contributes $653 million worth of domestic value-added in exports to Viet Nam that are then used by Viet Nam for its own export production.