Additional features
5.3 Download data
RIVA Value Chain Analyzer also provides a flexible data querying feature to allow users to download detailed data on trade in value-added estimates and GVC indicators to facilitate specialized research needs. This allows for selection of indicators, economies, sectors and years of interest for download, helping users avoid the time consuming hassle of bulk downloading large data sets and manually filtering them for desired information. RIVA also supports saving queries for future use, allowing frequent users to further expedite downloading data.
After signing up for a free account, accessing the ‘Data downloads’ section is just a click away. See for yourself.
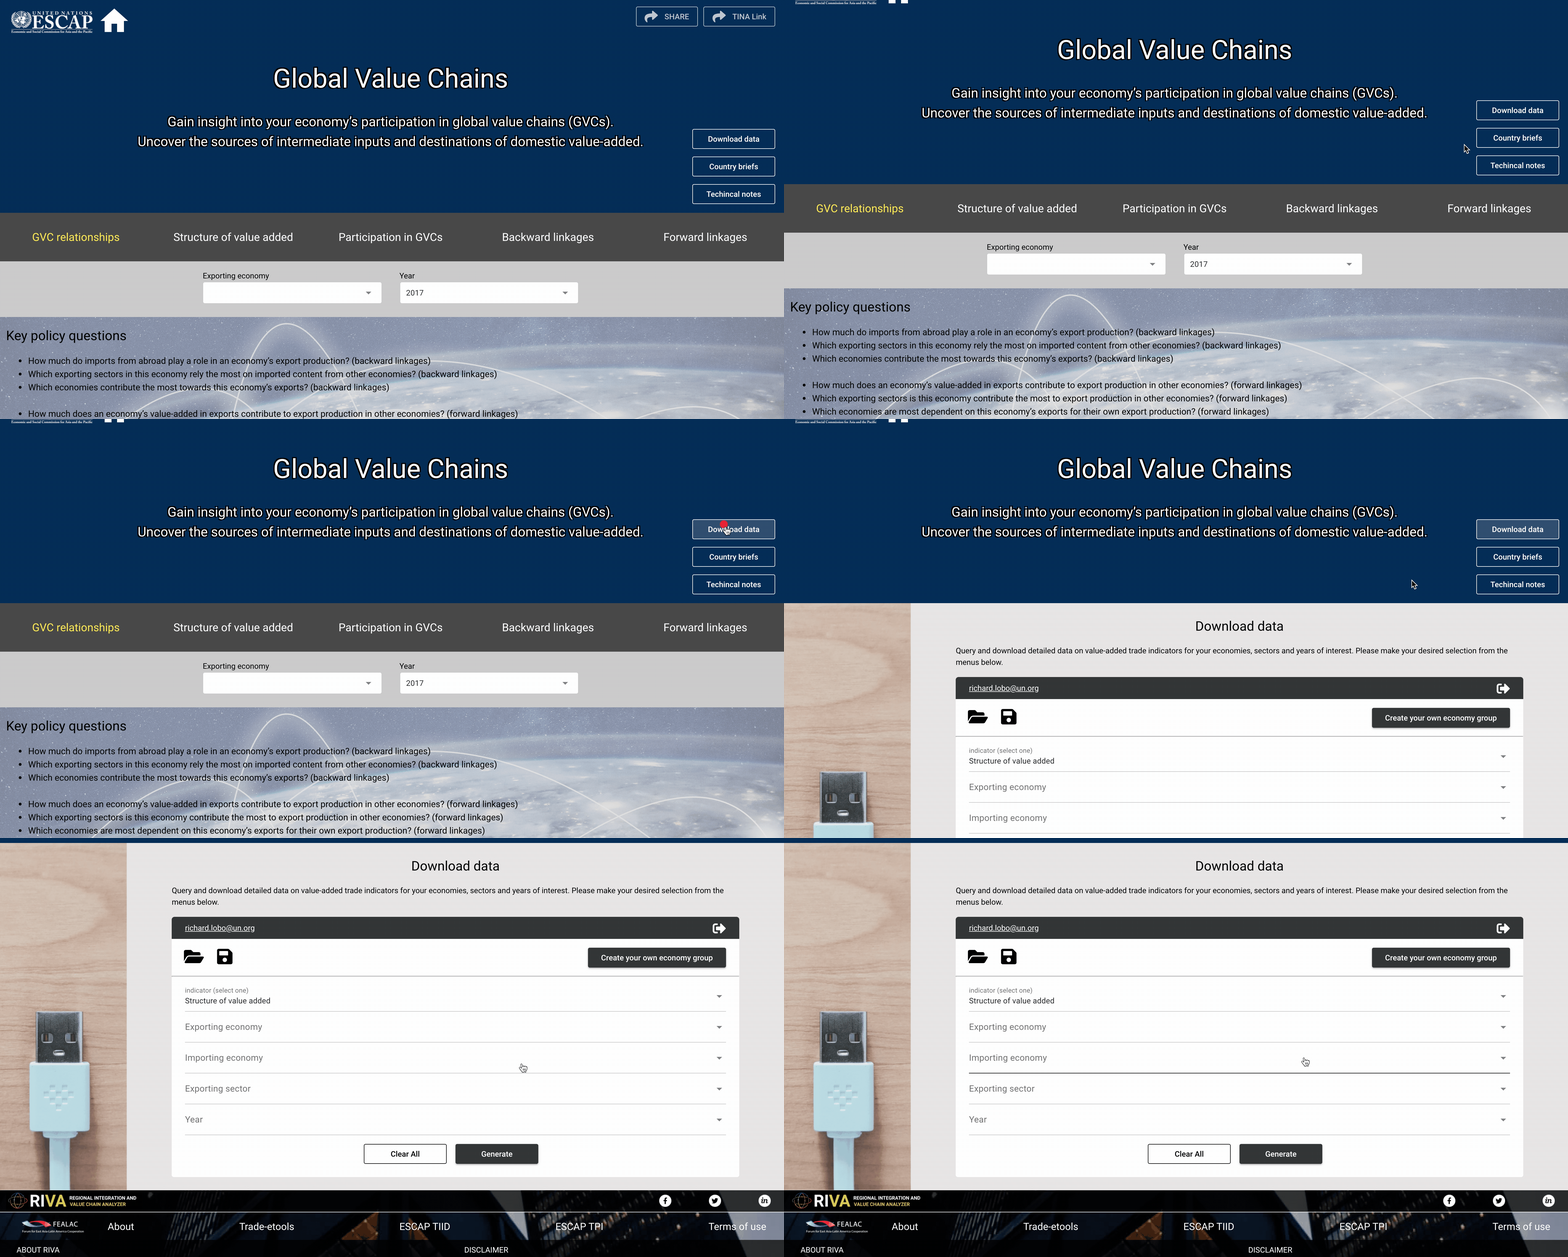
Figure 5.3: Download data: Accessing Data downloads
Choose an indicator of interest, say ‘Backward linkages (by source economy)’.
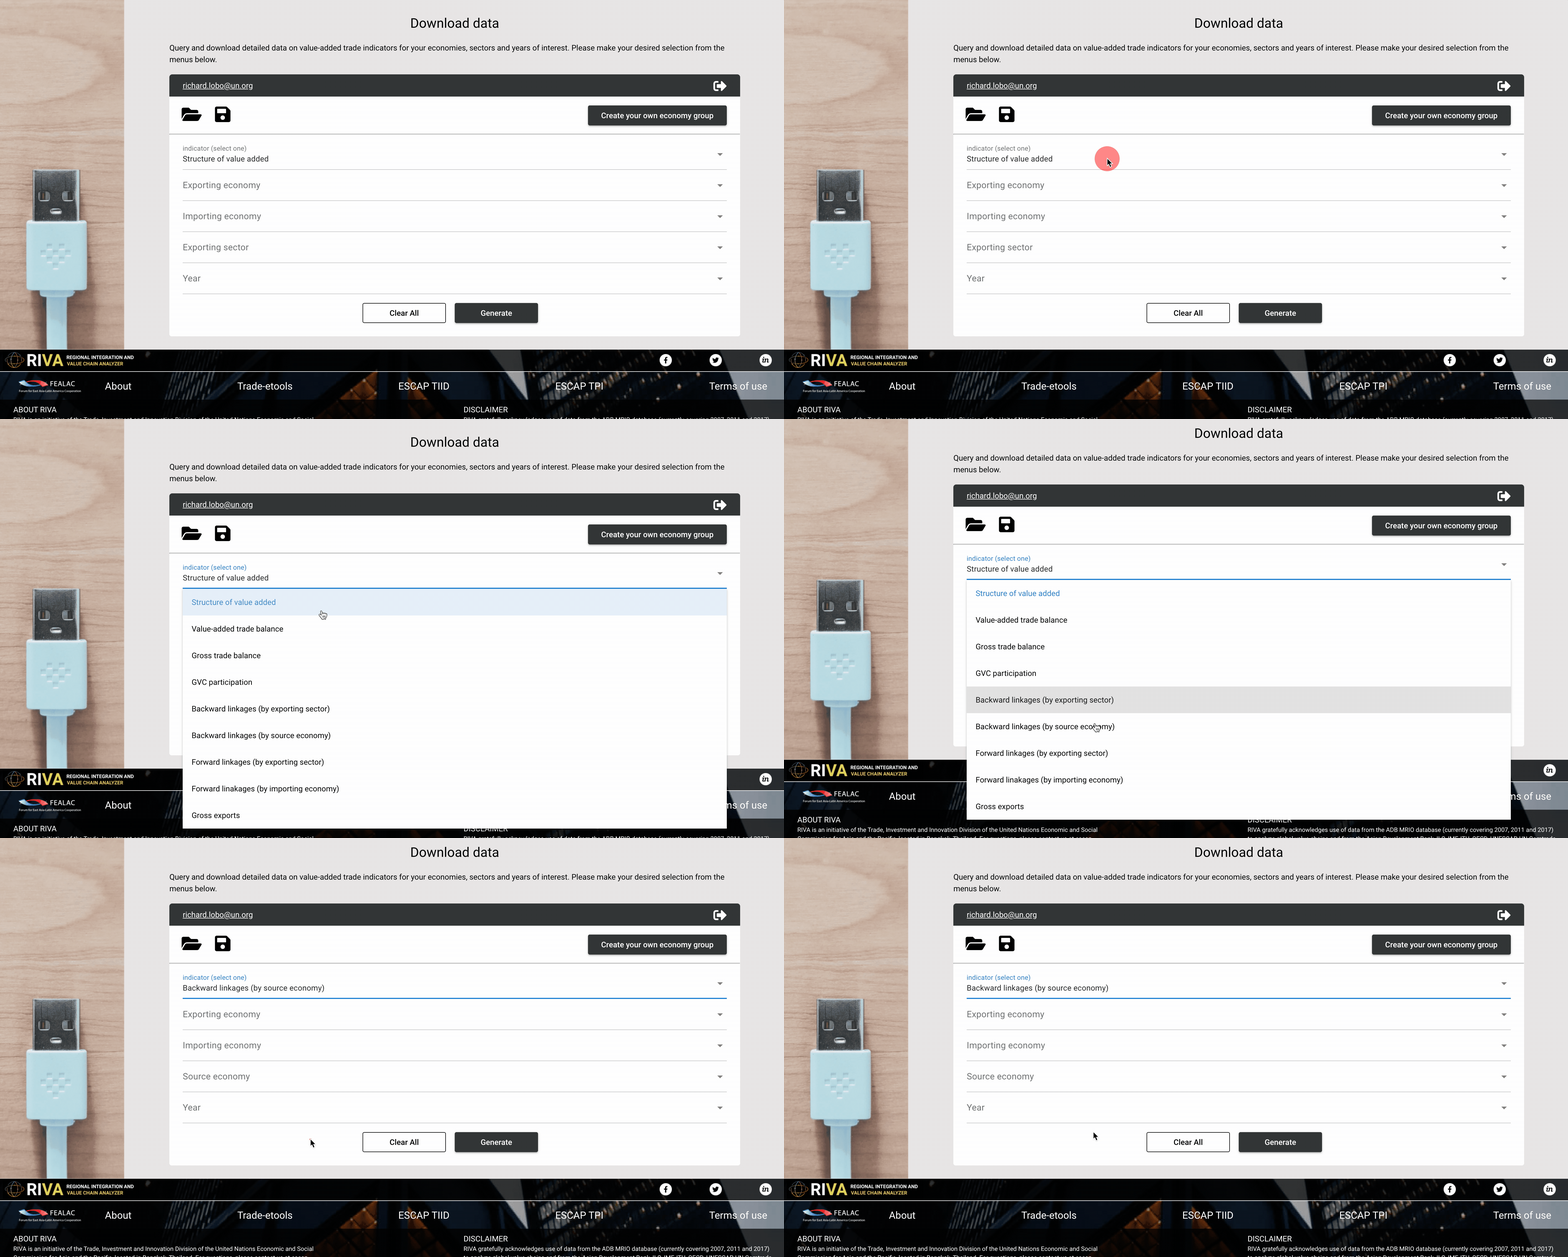
Figure 5.4: Download data: Choosing an indicator
Choose one or more exporters, for example, Japan, Thailand and Viet Nam. Feel free to choose as many as you like though, there is no limit on selection.
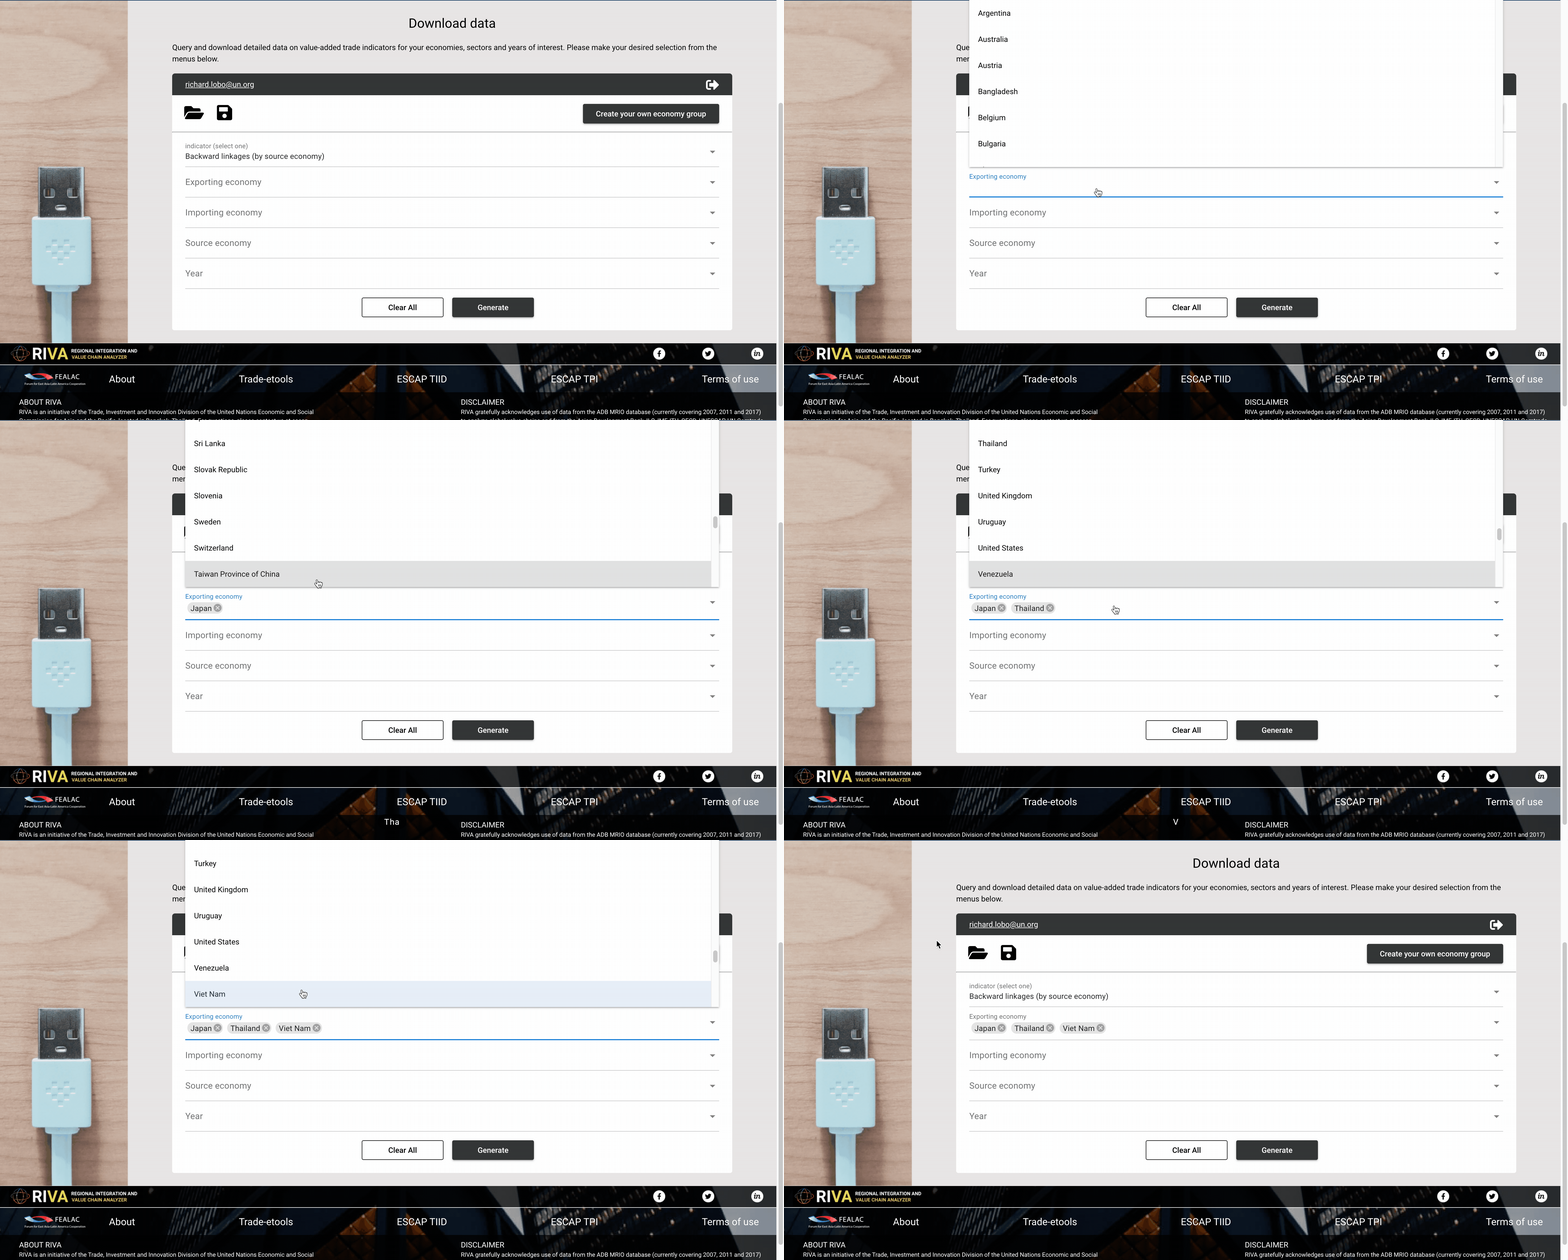
Figure 5.5: Download data: Choosing exporters
Source: RIVA Value Chain Analyzer
Follow the same process for choosing importing and source economies. In this example, let us choose United States and Germany as the importing economies, and China as the source economy.
Finally, select your year/s of interest, say 2007 and 2017.
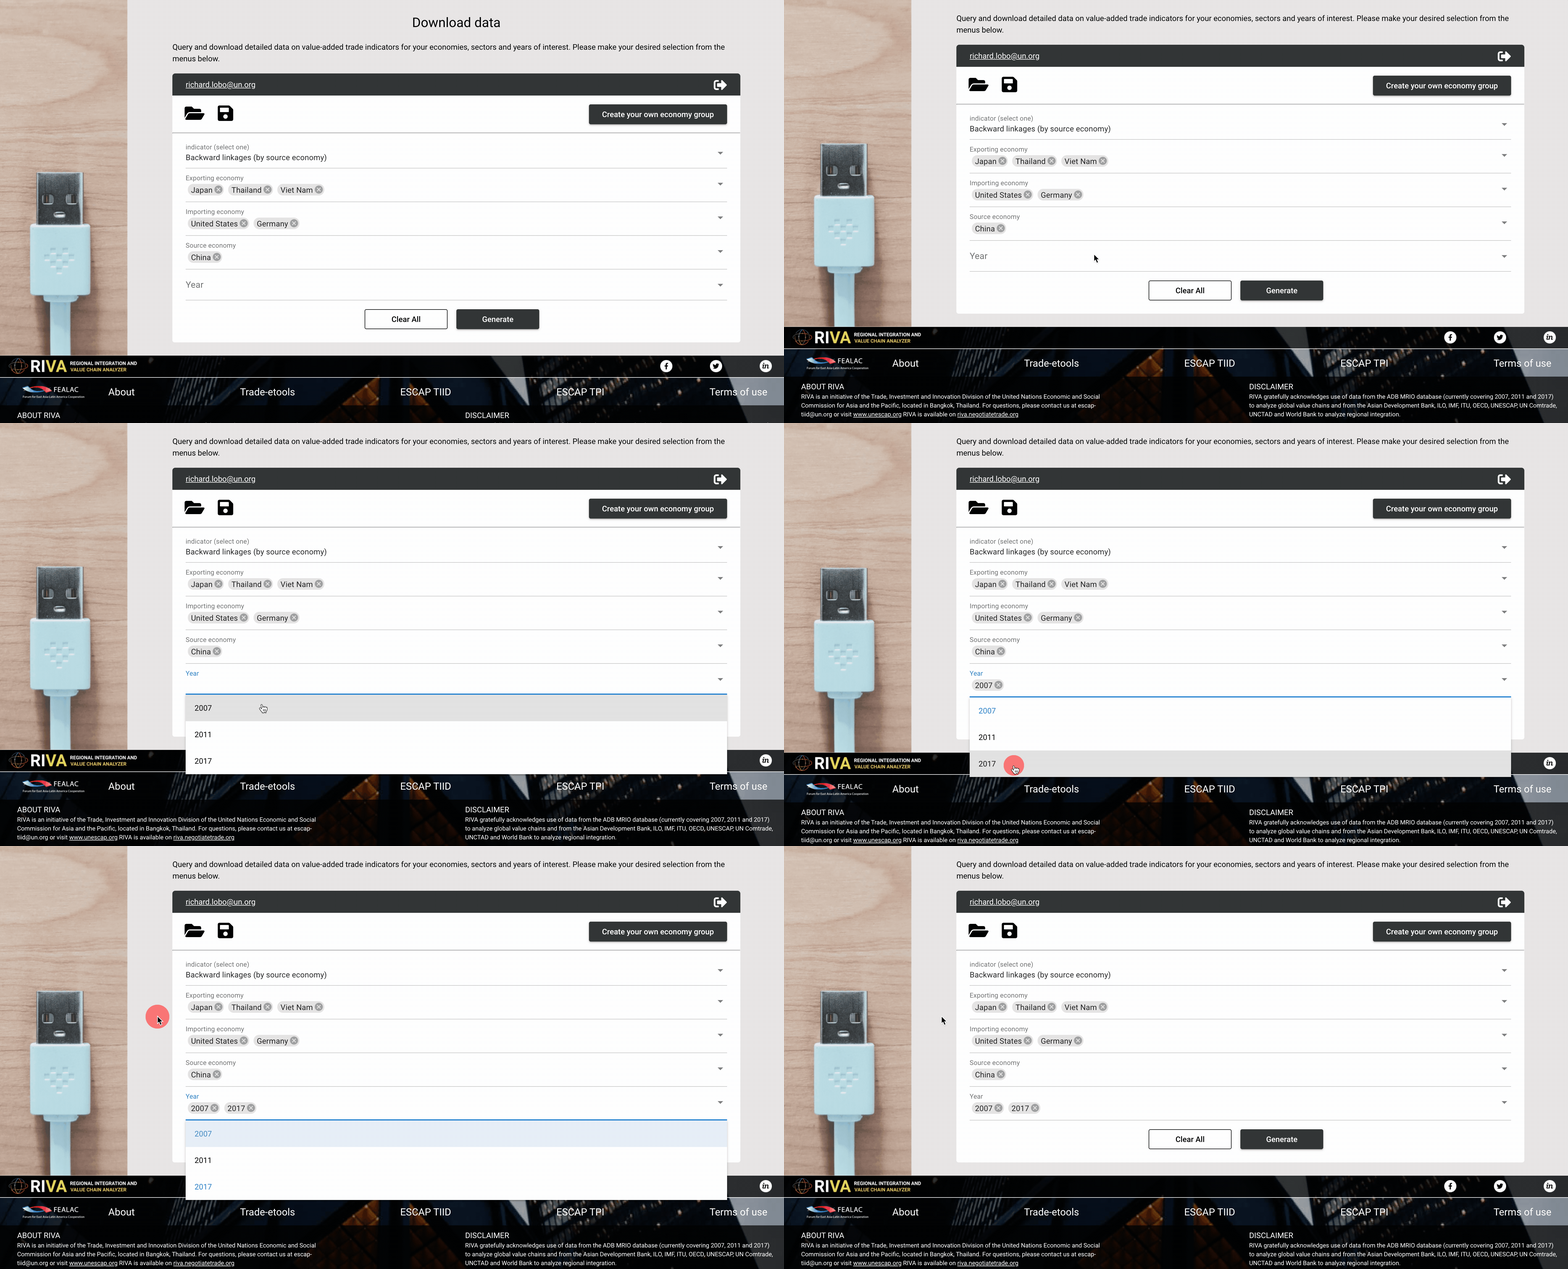
Figure 5.6: Download data: Selecting years
Simply click ‘Generate’ and wait a few seconds for the data to get prepared for download. Then click the same button again when it turns blue and says ‘Download Data’.
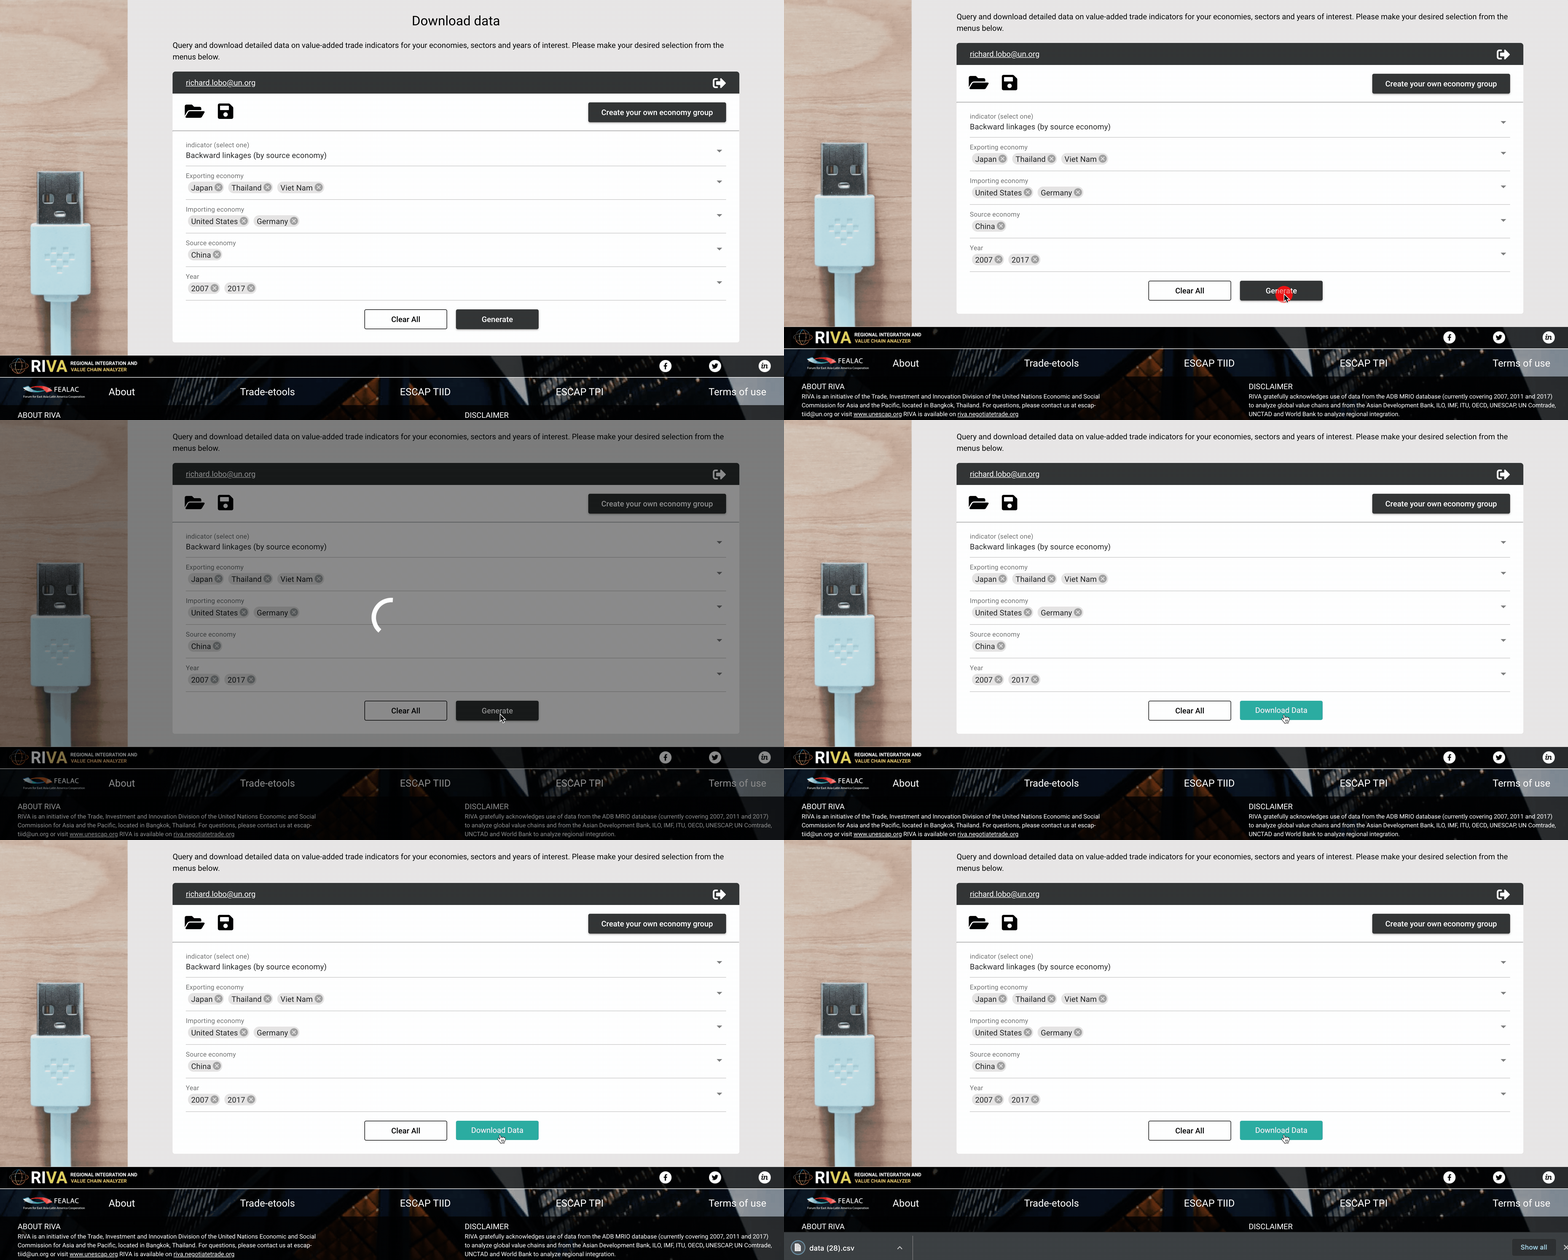
Figure 5.7: Download data: Downloading selected data
RIVA also allows you to save your data queries for future use. Once you have made all your desired selections for indicator, economies and years, simply click on the ‘Save query’ button located above the ‘Indicator’ selection menu (the icon on the right).
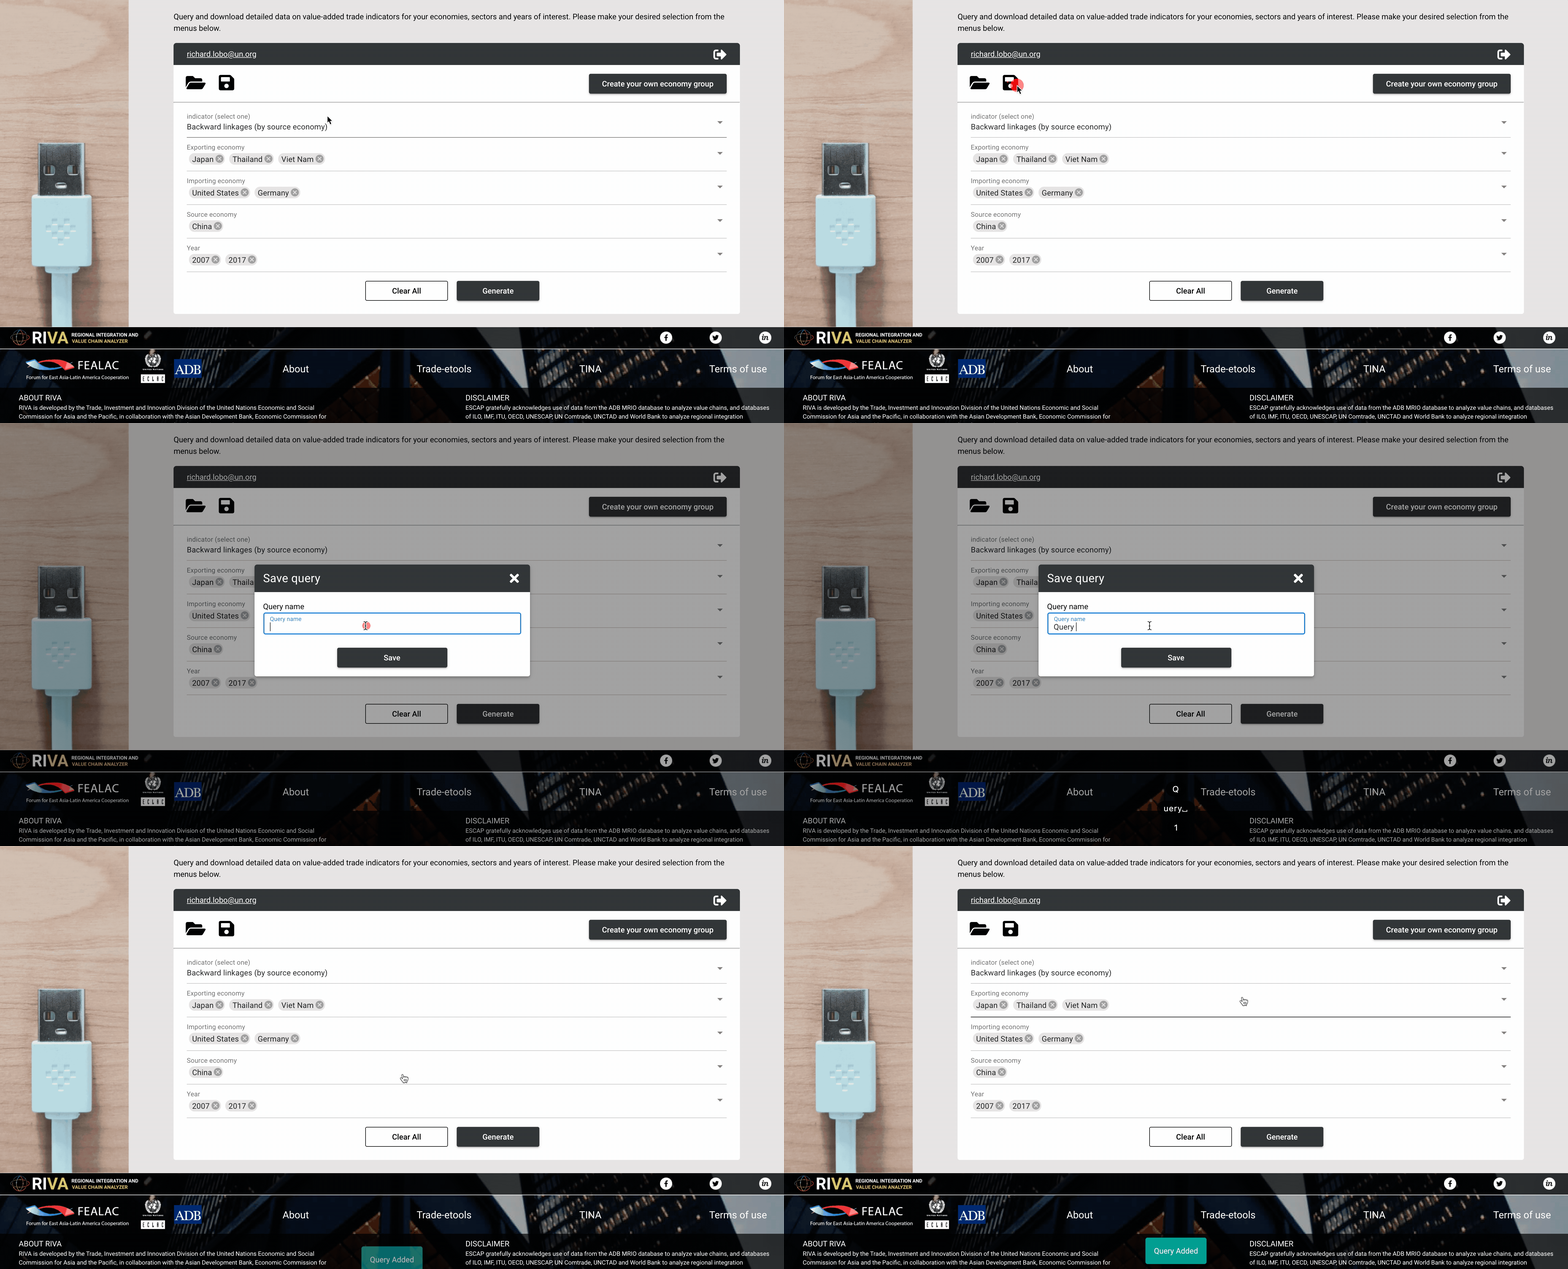
Figure 5.8: Download data: Saving queries for future use
These saved data queries can be accessed at any time from the ‘Open query’ button located above the ‘Indicator’ selection menu (the icon on the left)
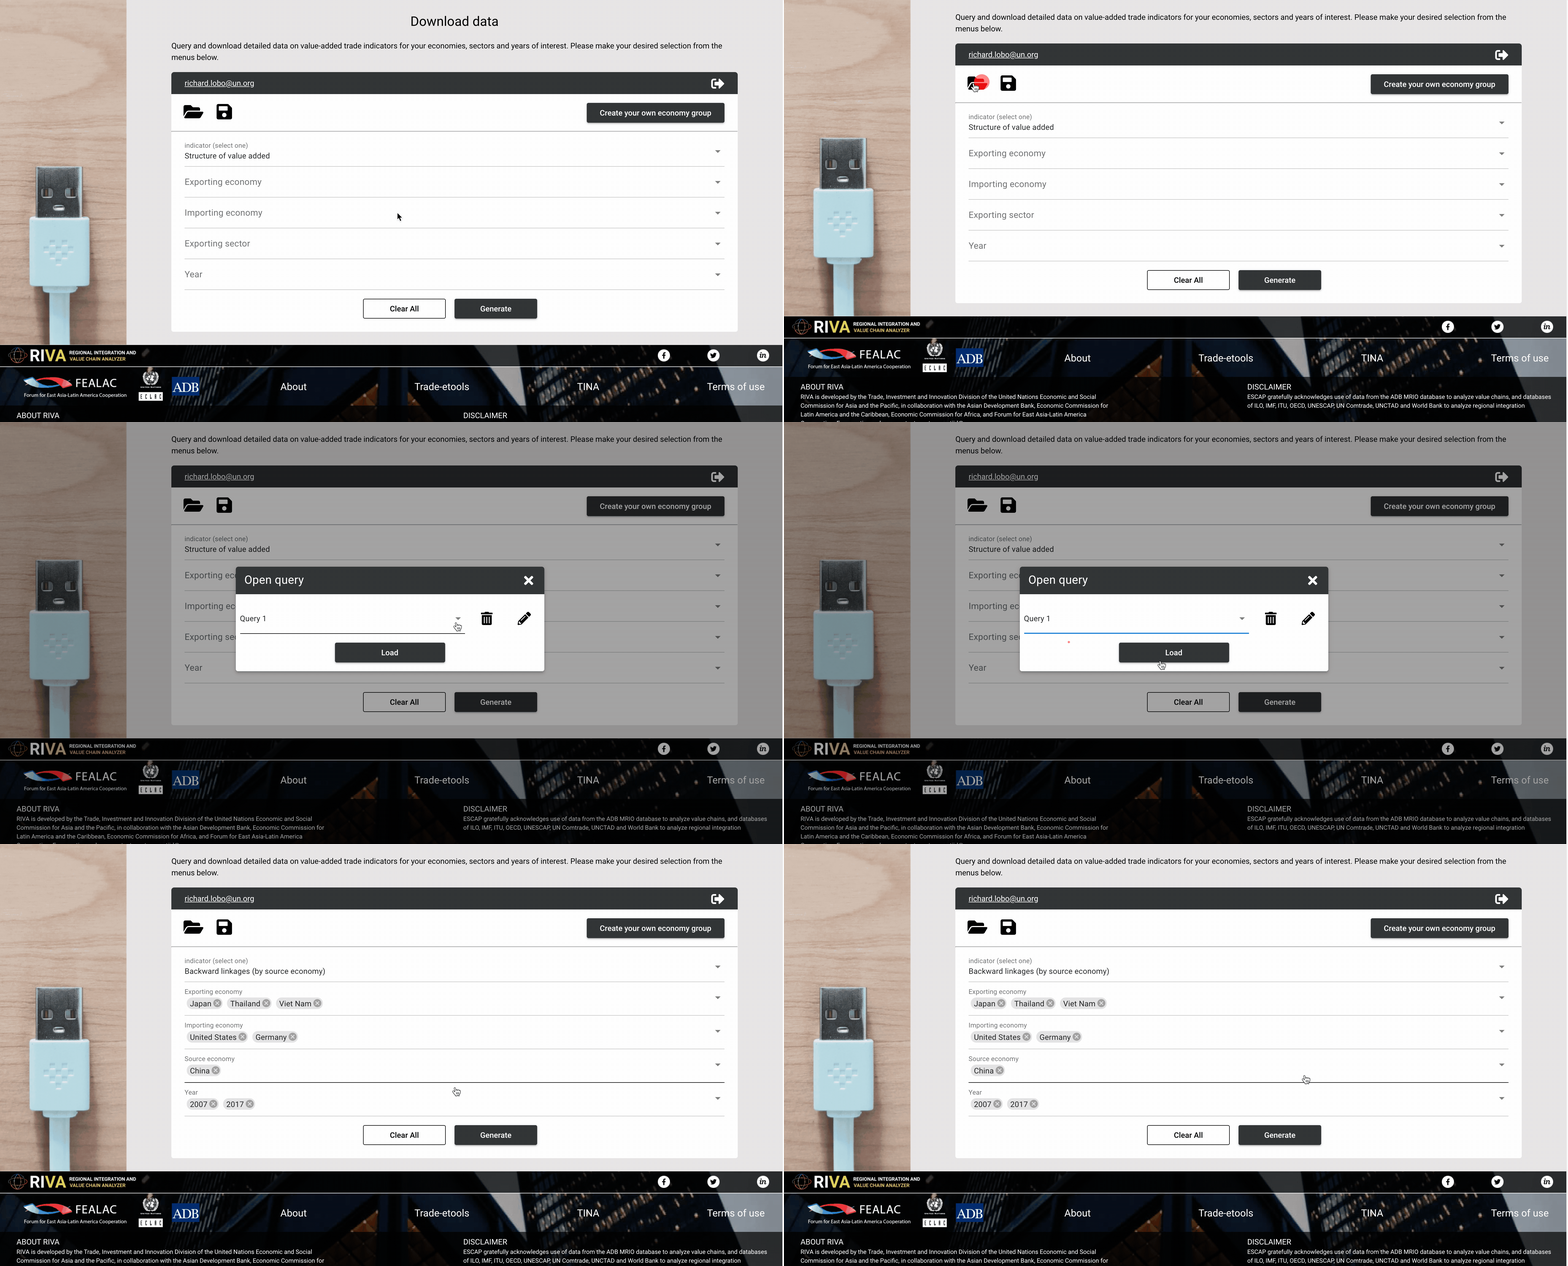
Figure 5.9: Download data: Opening saved queries
What’s more, RIVA even allows you to create your own economy groups if you are interested in treating a set of economies as a single unit. While RIVA provides pre-calculated values for 20 well-known economy groups, the ‘Create your own economy group’ option is designed keeping in mind the most advanced users with very specific analytical needs.
Creating and using your own economy groups couldn’t be easier. As an example, we create an economy group consisting of India, Indonesia and Republic of Korea and call it Group 1.
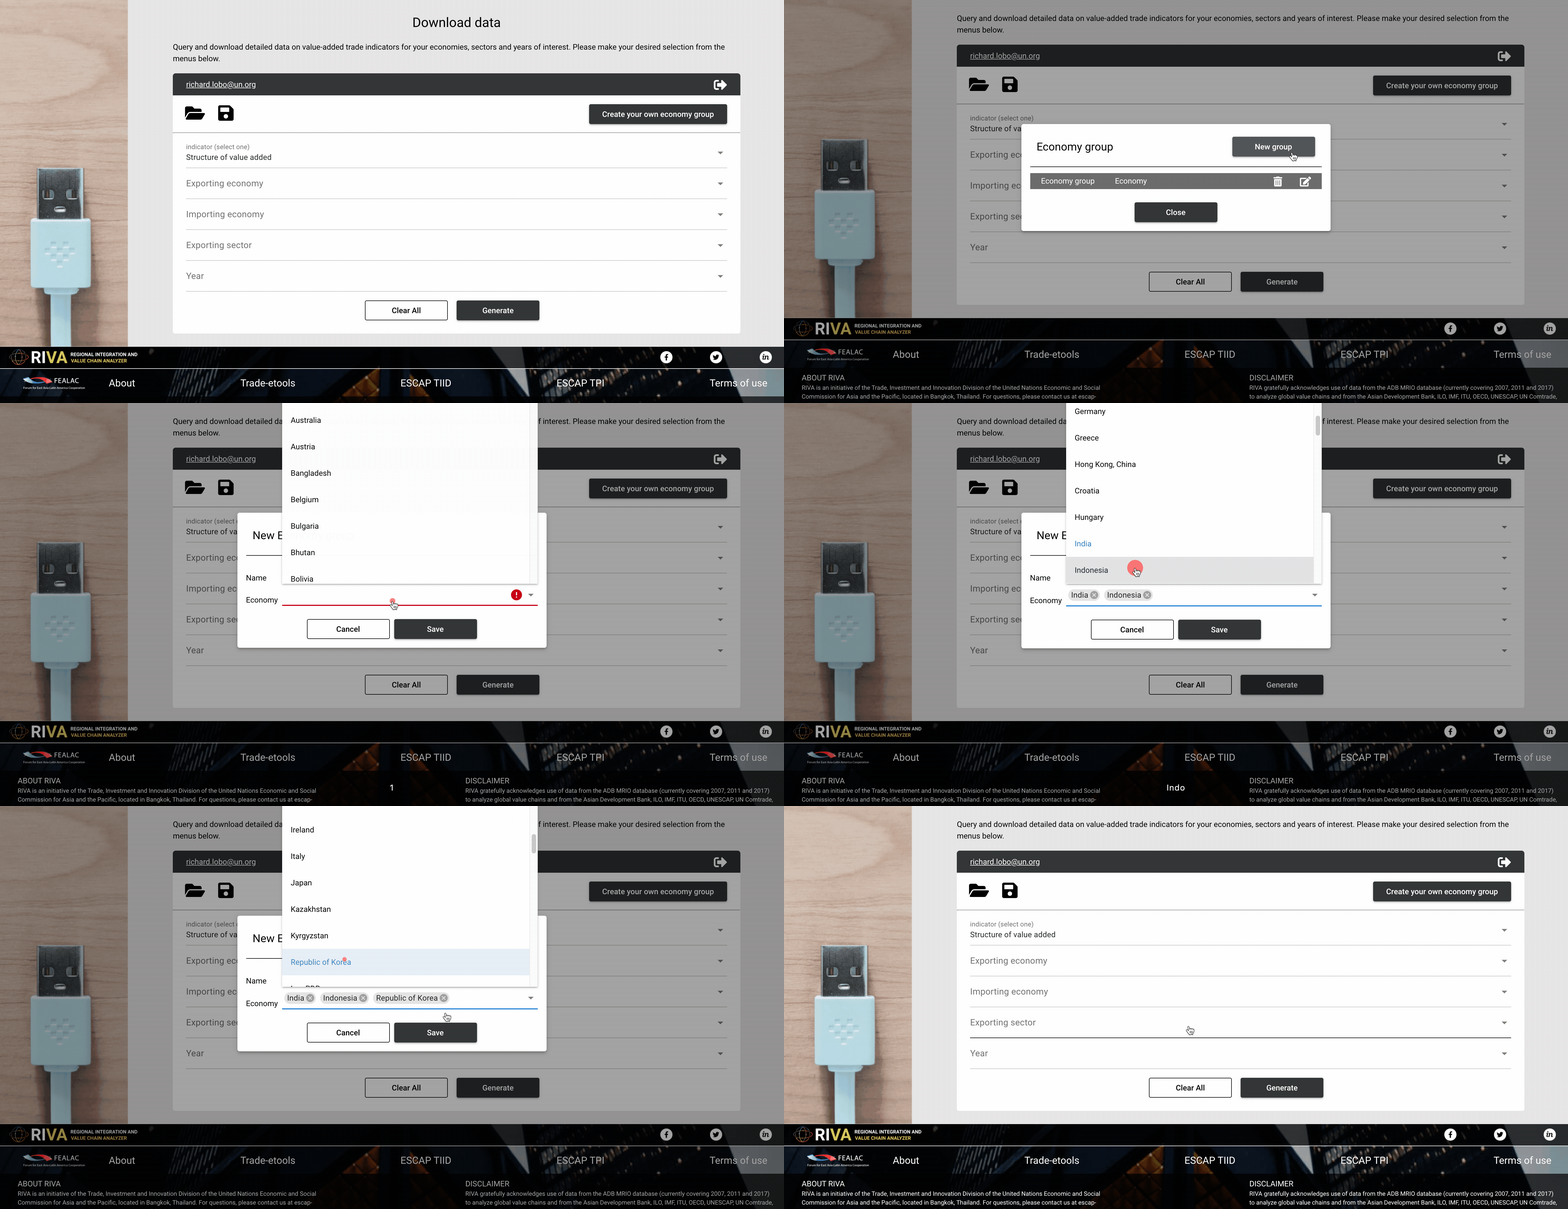
Figure 5.10: Creating your own economy group
5.4 Country briefs
Another feature that RIVA Value Chain Analyzer provides is automated country briefs. These are documents that provide summarized and curated insights for a selected economy. The aim of the country briefs feature is to provide users with a way to quickly review key information on trade in value-added estimates and GVC linkages for an economy of interest, for any available year.
As an example, we look at a country brief for Thailand, 2017.
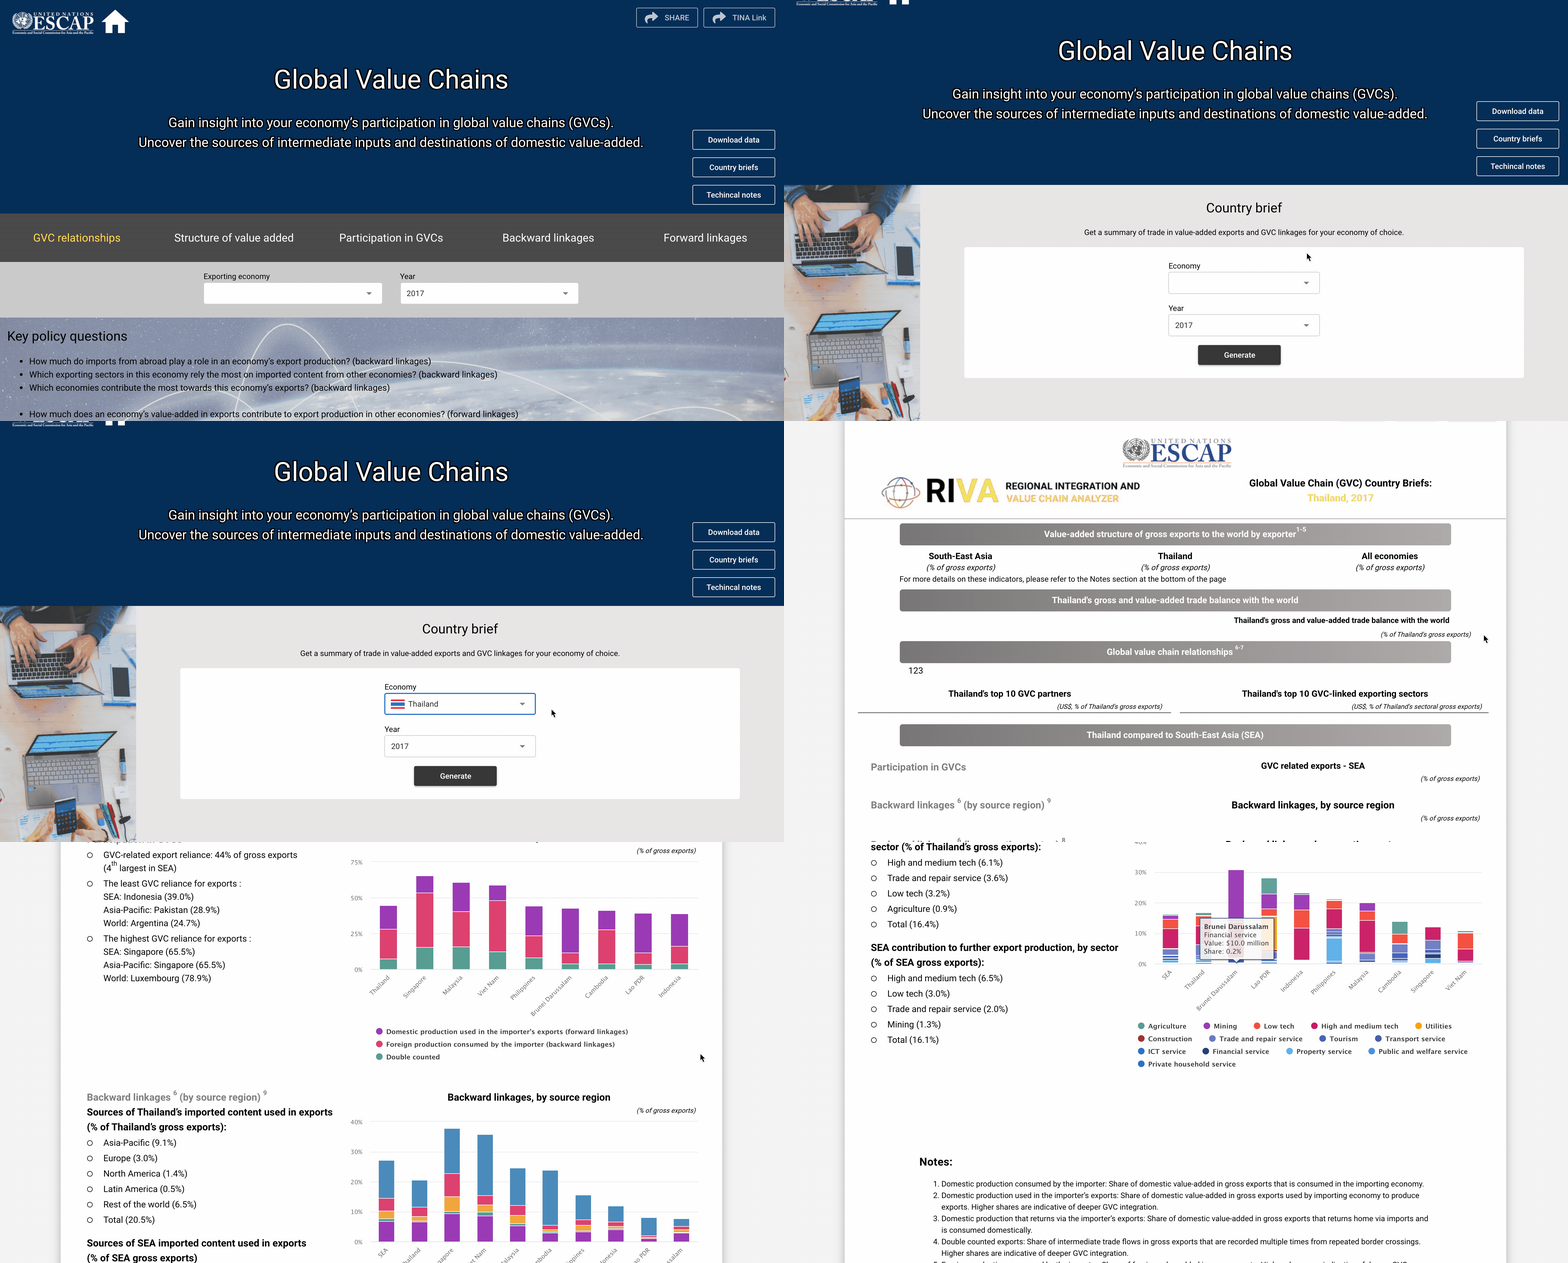
Figure 5.11: Accessing Country briefs