4 Backward linkages
The objective of this section of RIVA is to provide insight into an economy’s backward linkages, i.e. to describe where imported content used in an economy’s exports comes from and how it is used across exporting sectors. This helps highlight the structure of dependence an economy has on imported content used in its exports, how this varies across importing destinations, and the sectoral pattern of use.
In this example, let us consider Thailand’s backward participation in its exports to the world. Have a closer look at the Backward linkages section on the website to find out more about Thailand’s backward linkages, or any other economy you may be interested in.
This section of RIVA has two sub-sections, namely ‘Select by exporting sector’ and ‘Select by source economy’.
‘Select by exporting sector’ provides a breakdown of source economies where imported content used in exports comes from for a selected exporting sector.
‘Select by source economy’ provides a breakdown of how imported content from a selected source economy is used across exporting sectors in the exporting economy.
These two sub-sections are described below.
4.1 By exporting sector
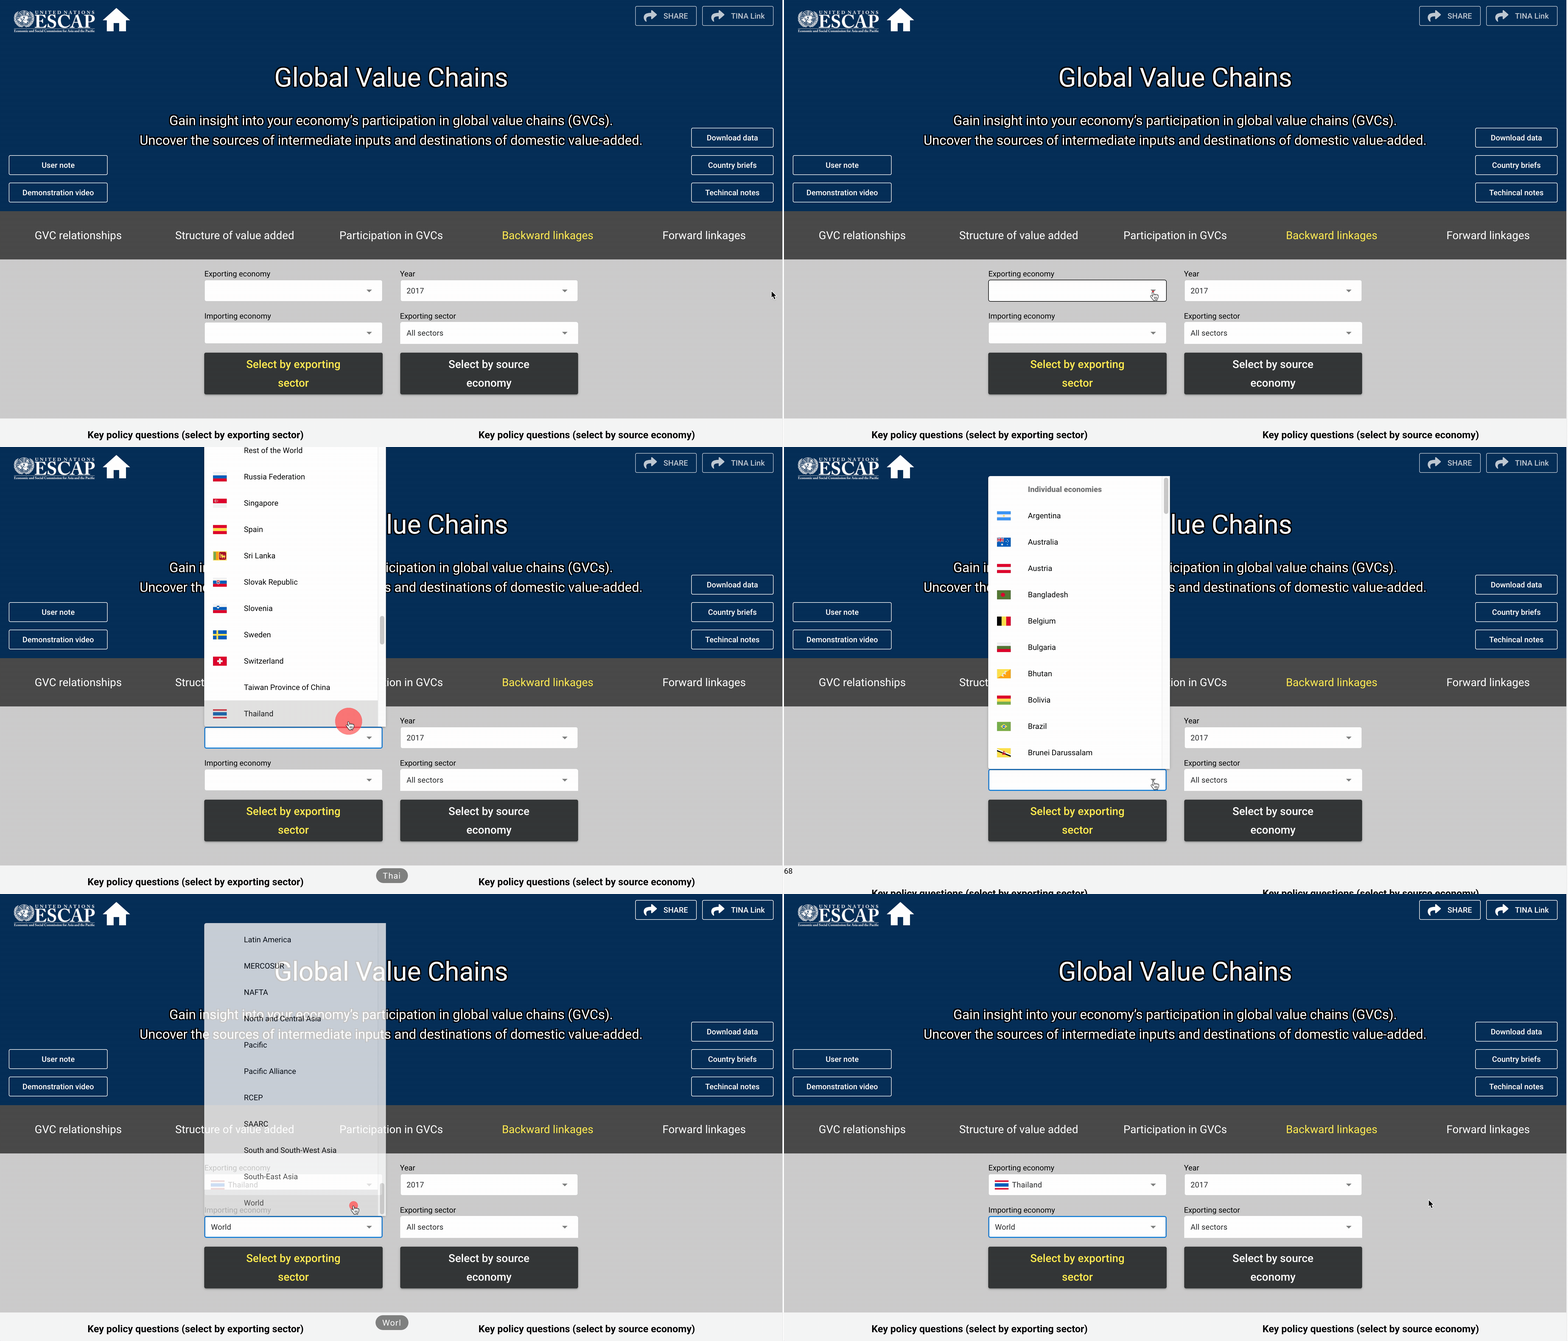
To examine Thailand’s backward linkages in its exports to the world, click on the ‘Backward linkages’ section on the navigation bar. From here, choose your exporting economy of interest (in this example, Thailand) and importing economy (in this example, ‘World’) from the drop-down menu as shown below:

Figure 4.1: Backward linkages, by exporting sector: Choosing exporting and importing economies
You can change the year of interest or exporting sector in a similar manner. In this example, we maintain the pre-selected year, i.e. 2017, and the pre-selected exporting sector, i.e. ‘All sectors’.
The first visualization you will see after making these selections is shown below:
This tree map visualization contains a number of useful details. To begin with, the question at the top of the graph already gives you an indication of what to expect: ‘Where does Thailand’s imported content in exports of all sectors to World come from?’. To break this question down, Thailand is the exporting economy of interest and we are considering its exports to the World (importing economy) for all exporting sectors. Most importantly, we are concerned with where imported content used in these exports comes from.
The visualization provides a number of useful insights, described below:
You can examine the breakdown of sources of imported content by region and country. For example, we can see that Asia-Pacific (in blue) is the largest source of imported content used in Thailand’s exports to the world. Moreover, China accounts for 11.46% of total imported content used in Thailand’s exports to the world. Hover your mouse over the China section to see more details: you will see this amounts to $5.6 billion.
In a similar manner, you can examine any section of the tree map for any of the economies shown to get more details on Thailand’s backward linkages with a particular economy.
There is also an explanatory paragraph between the question and the tree map that further assists users in interpreting the results shown in the graph.
Below this explanatory paragraph, in the top left corner of the graph, are 2 additional values that complement the results in the graph. The first (Thailand’s imported content in exports to World: $49.23 billion) is simply the sum of all the $ values in the tree map, i.e. the total value of imported content used by Thailand in its exports to the world. The second (Thailand’s gross exports to World: $238.86 billion) is self explanatory. Comparing these two values helps contextualize the importance of backward linkages for Thailand’s exports to the world.
You can download the graph and underlying data by simply clicking on the three horizontal bars icon on the top right corner of the graph and choosing your preferred format for download.
The second visualization you will see scrolling down on this page is shown below:
This bar graph is designed to help you compare the results for Thailand’s backward linkages with equivalent results for all other economies in the same sub-region (in this case South-East Asia). At first glance, the graph shows you the share that backward linkages account for in gross exports to the selected importer (in this case, world) across all South-East Asia economies. This highlights that Singapore and Viet Nam have the largest backward linkages (over 35% of gross exports to world) while Brunei Darussalam and Lao PDR have the smallest (under 10% of gross exports to world).
There are also a number of additional insights that this graph offers us through its interactive features. Simply hover your mouse over any of the bars in the graph to see relevant information:
For example, hover your mouse over the blue bar (Asia-Pacific) for Viet Nam. You will see that imported content coming from Asia-Pacific used in Viet Nam’s exports to the world account for 20.49% of its gross exports to the world. This is also shown in absolute terms ($46.59 billion).
You can also drill-down into this bar to see which particular economies in Asia-Pacific are the sources of Viet Nam’s imported content. To do this, simply click on the blue bar for Viet Nam. This will drill-down into a pie chart showing the value of imported content sourced from individual Asia-Pacific economies. Hover your mouse over an economy to see more details: considering China, the value 7.99% ($18.2 billion) indicates the share of Viet Nam’s gross exports to the world that comprise imported content from China. Click the button in the top right corner of the graph that says ‘Back to Asia-Pacific’ to return to the bar graph with all South-East Asia economies.
In a similar manner, you can undertake a detailed examination of the regional structure of any South-East Asia economies’ backward linkages in exports to the world (or any importing economy of your choice).
You can also click on any of the legend items to remove a selected region from the graph. Click it again to add it back in.
Finally, you can also download the graph and underlying data by simply clicking on the three horizontal bars icon on the top right corner of the graph and choose your preferred format for download.
4.2 By source economy
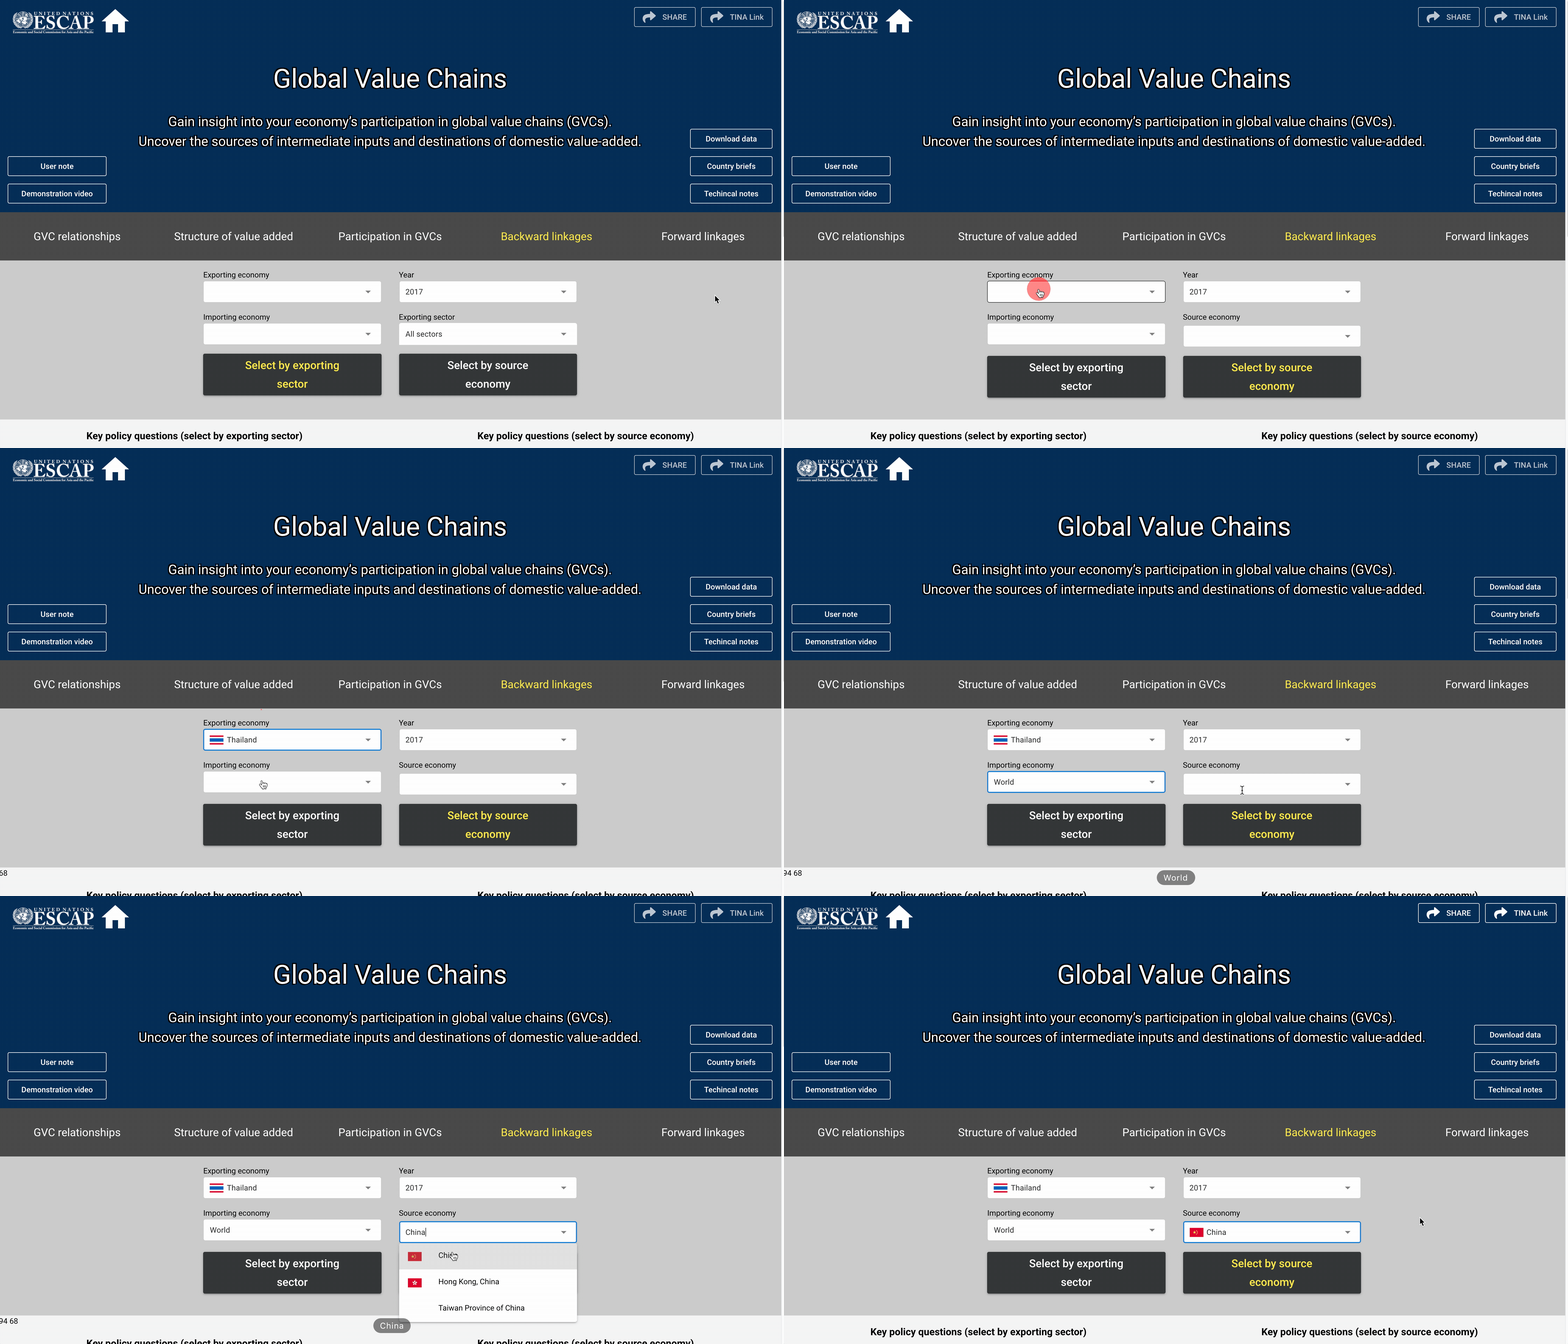
Now, to examine Thailand’s backward linkages in its exports to the world by source economy, click on the ‘Select by source economy’ button in the ‘Backward linkages’ section of RIVA. From here, choose your exporting economy of interest (in this example, Thailand), importing economy (in this example, ‘World’), and source economy (in this example, China) from the drop-down menu as shown below:

Figure 4.2: Backward linkages, by source economy: Choosing exporting, importing and source economies
You can change the year of interest in a similar manner. In this example, we maintain the pre-selected year, i.e. 2017.
The first visualization you will see after making these selection is shown below:
This tree map visualization contains a number of useful details. To begin with the question at the top of the graph already gives you an indication of what to expect: ‘How is China’s value-added in Thailand’s exports to World distributed across sectors?’. To break this question down, Thailand is the exporting economy of interest and we are considering its exports to the World (importing economy). Most importantly, we are concerned with how imported content used in these exports coming from China (source economy) is used across exporting sectors in Thailand.
The visualization provides a number of useful insights, described below:
You can examine the breakdown of how imported content from China is used across exporting sectors in Thailand. For example, we can see that Manufacturing: high and medium tech (in red) uses the most imported content from China for its exports to the world. Specifically, we can see that Fabricated metals (22.09%) is the exporting sector in Thailand that uses the majority of imported content sourced from China for its exports to the world. Hover your mouse over the Fabricated metals section to see more details: you will see this amounts to $1.25 billion.
In a similar manner, you can examine any section of the tree map for any of the exporting sectors shown to get more details on Thailand’s sectoral use of imported content from China used in exports to the world.
There is also an explanatory paragraph between the question and the tree map that further assists users in interpreting the results shown in the graph.
Below this explanatory paragraph, in the top left corner of the graph, are 2 additional values that complement the results in the graph. The first (Thailand’s imported content from China in exports to World: $5.64 billion) is simply the sum of all the $ values in the tree map, i.e. the total value of imported content sourced from China used by Thailand in its exports to the world. The second (Thailand’s gross exports to World: $238.86 billion) is self explanatory. Comparing these two values helps contextualize the importance of backward linkages with China for Thailand’s exports to the world.
You can download the graph and underlying data by simply clicking on the three horizontal bars icon on the top right corner of the graph and choosing your preferred format for download.
The second visualization you will see scrolling down on this page is shown below:
This bar graph is designed to help you compare the results for Thailand’s backward linkages (specifically, with China as the source and World as the importer) with equivalent results for all other economies in the same sub-region (in this case South-East Asia). At first glance, the graph shows you the share that backward linkages with China account for in gross exports to the selected importer (in this case, world) across all South-East Asia economies. This highlights that Cambodia and Viet Nam have the largest backward linkages (about 8% of their gross exports to world is comprised of imported content from China) while Brunei Darussalam and Indonesia have the smallest (under 2% of gross export to world).
There are also a number of additional insights that this graph offers us through its interactive features. Simply hover your mouse over any of the bars in the graph to see relevant information:
For example, hover your mouse over the red bar (Manufacturing high and medium tech) for Viet Nam. You will see that imported content coming from China used in Viet Nam’s high and medium tech manufacturing exports to the world account for 2.43% of Viet Nam’s gross exports to the world. This is also shown in absolute terms ($5.53 billion).
You can also drill-down into this bar to see which particular sectors in Viet Nam’s Manufacturing high and medium tech use the largest amount of imported content from China for export production. To do this, simply click on the red bar for Viet Nam. This will drill-down into a pie chart showing the value of imported content sourced from China individual exporting sectors. Hover your mouse over a sector to see more details: considering Computer electronic and optical equipment, the value 0.78% ($1.78 billion) indicates the share of Viet Nam’s gross exports to the world that comprise imported content from China used in this sector. Click the button in the top right corner of the graph that says ‘Back to Manufacturing high and medium tech’ to return to the bar graph with all South-East Asia economies.
In a similar manner, you can undertake a detailed examination of the sectoral structure of any South-East Asia economies’ backward linkages in exports to the world (or any importing economy of your choice).
You can also click on any of the legend items to remove a selected sector-group from the graph. Click it again to add it back in.
Finally, you can also download the graph and underlying data by simply clicking on the three horizontal bars icon on the top right corner of the graph and choose your preferred format for download.